Setting up Graphing
- In the main Explorer window go to View --> Configuration Options.
- Choose the tab "Result Code Editors"
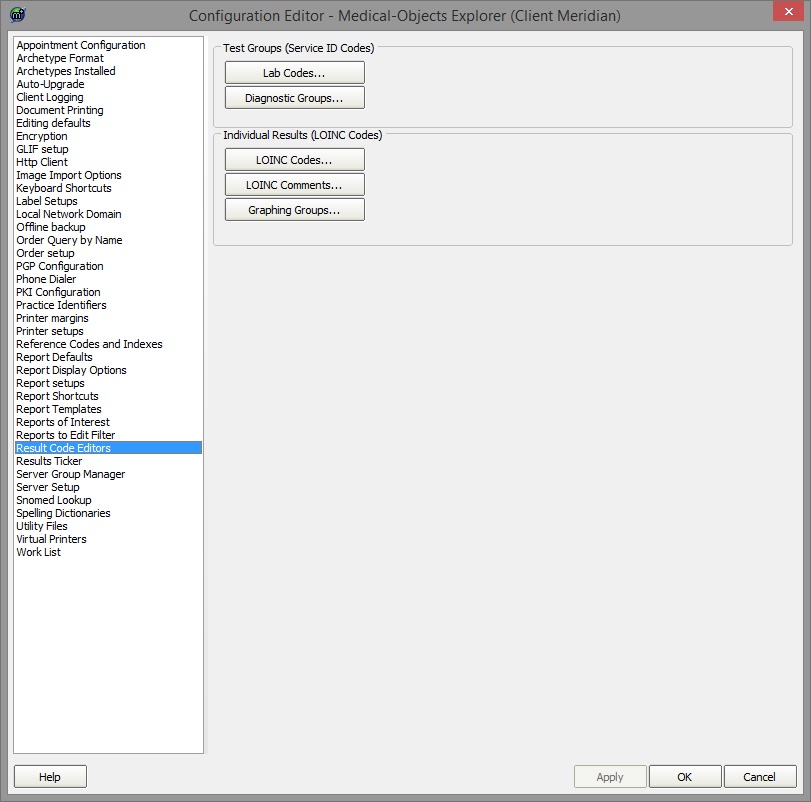
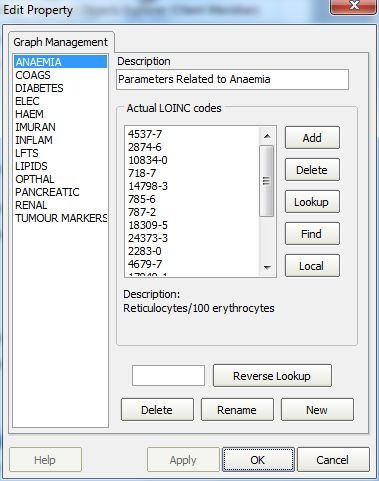
- To create a graph go to "Graphing Groups".
- At the bottom of the new window click the "New" button and give your group a name.
- You can add a description at the top.
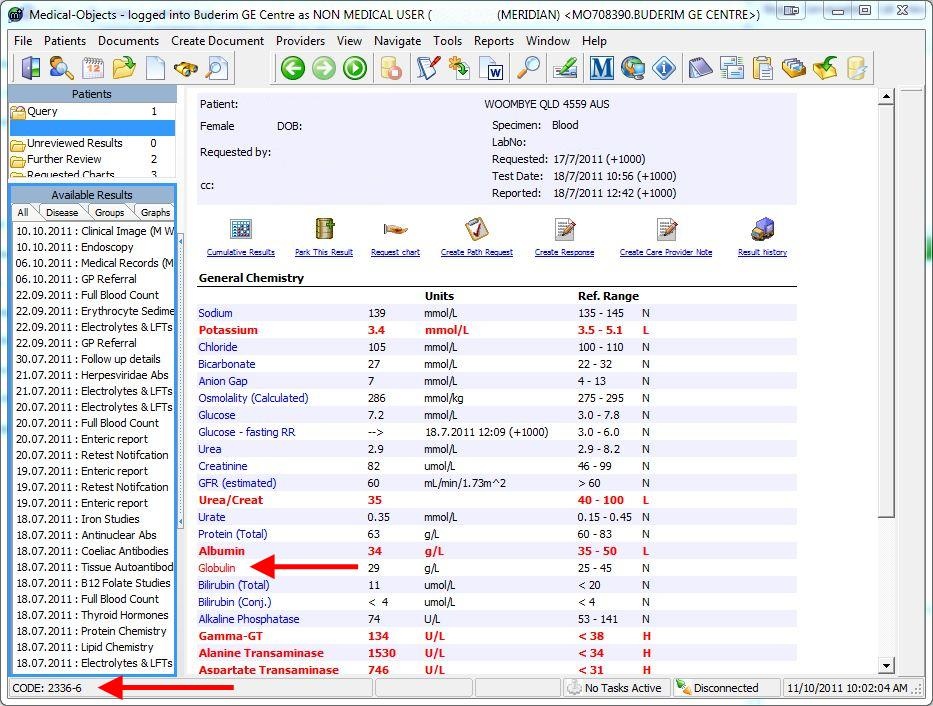
- NOTE: To find out the LOINC codes that your report contains you can hover over a test name (E.g. Globulin indicated by a red arrow) and the code is shown in the bottom left corner of the Explorer window (Indicated by a red arrow CODE: 2336-6).
Click the "Add" button to add each LOINC code that you want reported.
- Once you are done this set-up should load on the other Explorers connected to your server. They will require a restart to show the new graphs.
To group similar LOINC codes for graphing see Grouping LOINC Codes.
| Table of Contents | ||||
|---|---|---|---|---|
|