Overview
This guide provides a brief overview on viewing Letters and Results from within Medical-Objects Explorer (Meridian).
If you require any assistance with the installation or configuration, or if you have any questions, please contact the Medical-Objects Helpdesk on (07) 5456 6000.
Viewing Letters and Results
In order to view Patient Letters and Results, first Lookup the Patient using the Lookup Patient Dialog. For instructions on how to lookup a patient, refer to this guide.
- A List of Patients will be displayed in the table.
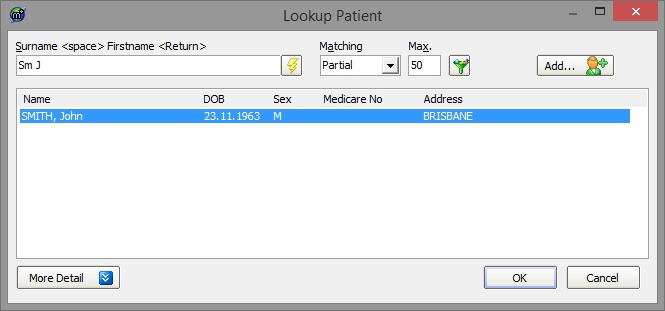
- To select a Patient, click the OK button and the patient will be added to the Query Folder at the top left hand side of the screen.
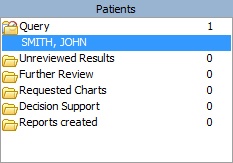
- From the Query Folder click on the patient to display the Current Results.
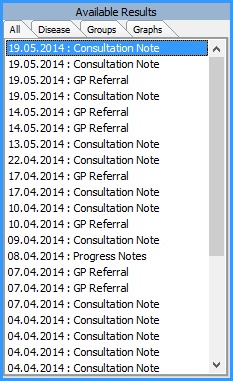
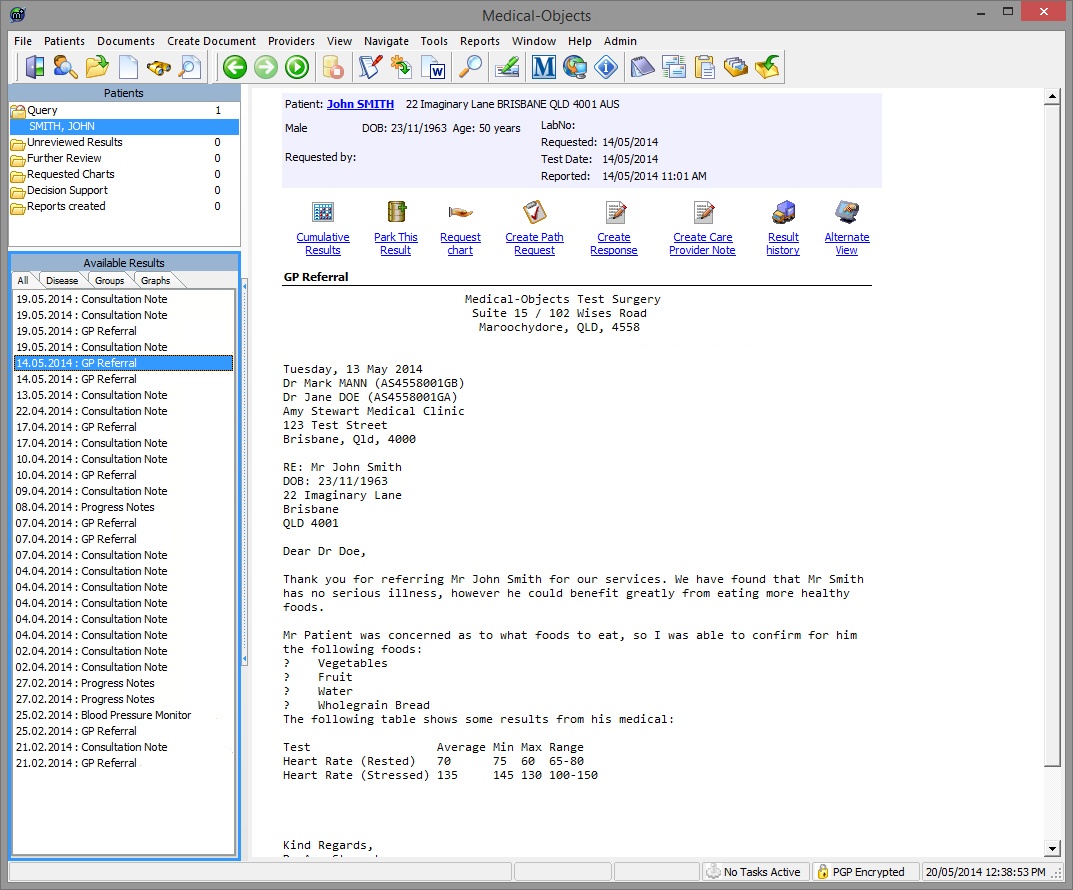
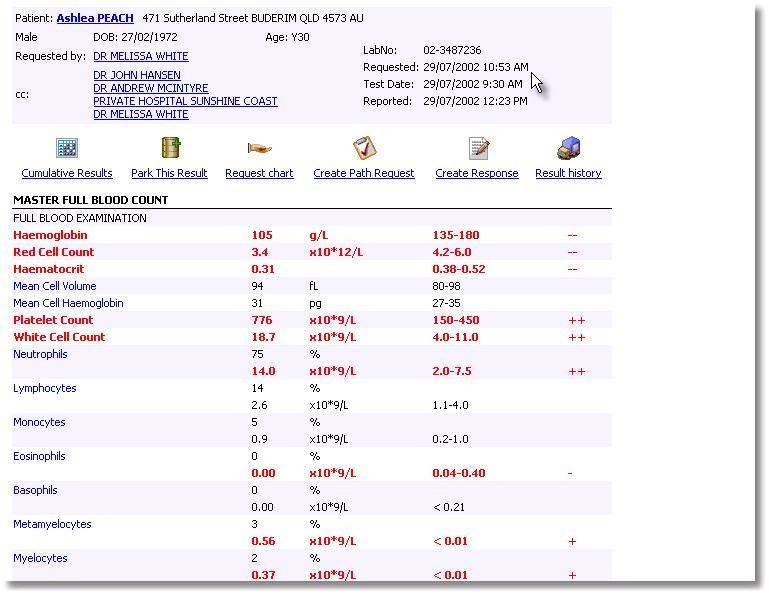
- Click on any of the Available Results and the Report will be displayed in the right hand window as shown below. You can then use the Icons above that result to work with that result or patient.
- To view by group, select the Groups tab from Available Results.
Viewing Results Cumulatively in a Graph
Click on any of the Available Results and the Report will be displayed in the right hand window.
![]()
By selecting the Cumulative Results icon from the Result Preview screen the results for a Patient over time are displayed side by side. This function only retrieves the same Result over time.
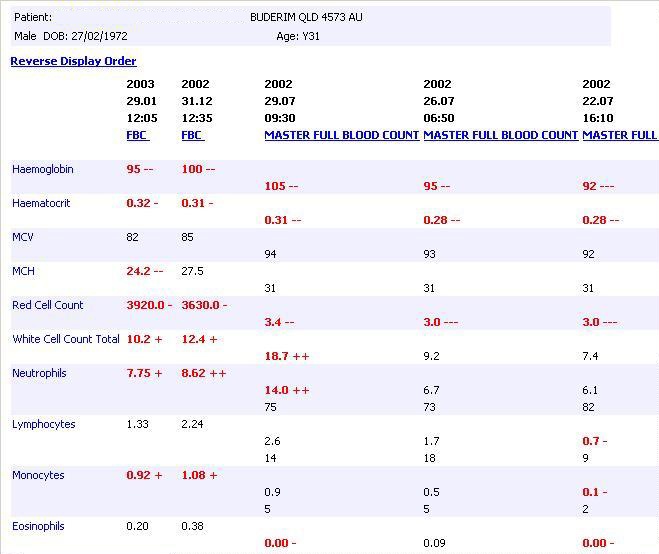
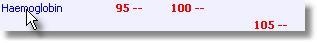
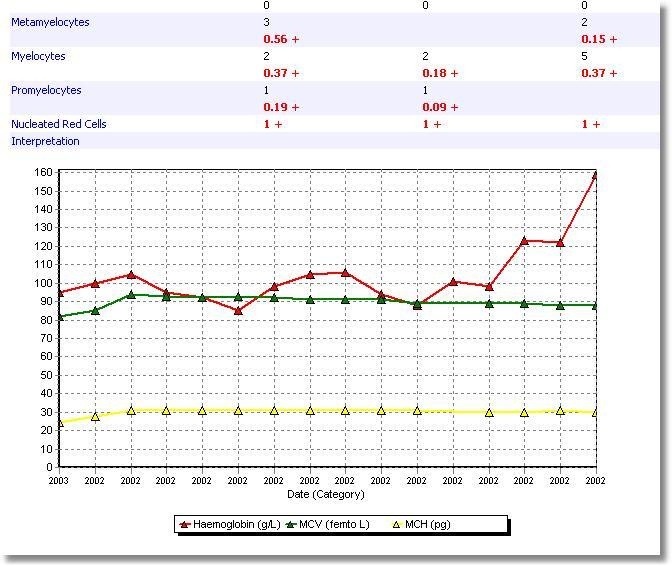
When viewing cumulative Pathology Results it is possible to click on the name of the measurement in blue on the left hand side of the screen to add it as a series to a Graph.
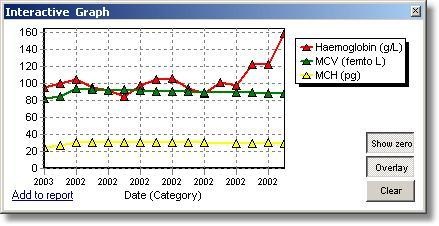
Marked differences in reference ranges limits the usefulness of this feature. However, Multiple Graphs can be added to the same Report. To do this, use the Graphs tab to define custom graphs where different reference ranges are compensated for and Graphs can be defined across different result types. For example to show Haemoglobin and C-Reactive Protein on the one Graph:
![]()
Clear Graphs - will delete the Graphs.
Hide Graphs - removes them from the current Report.
Show Graphs - adds them back into the Report.